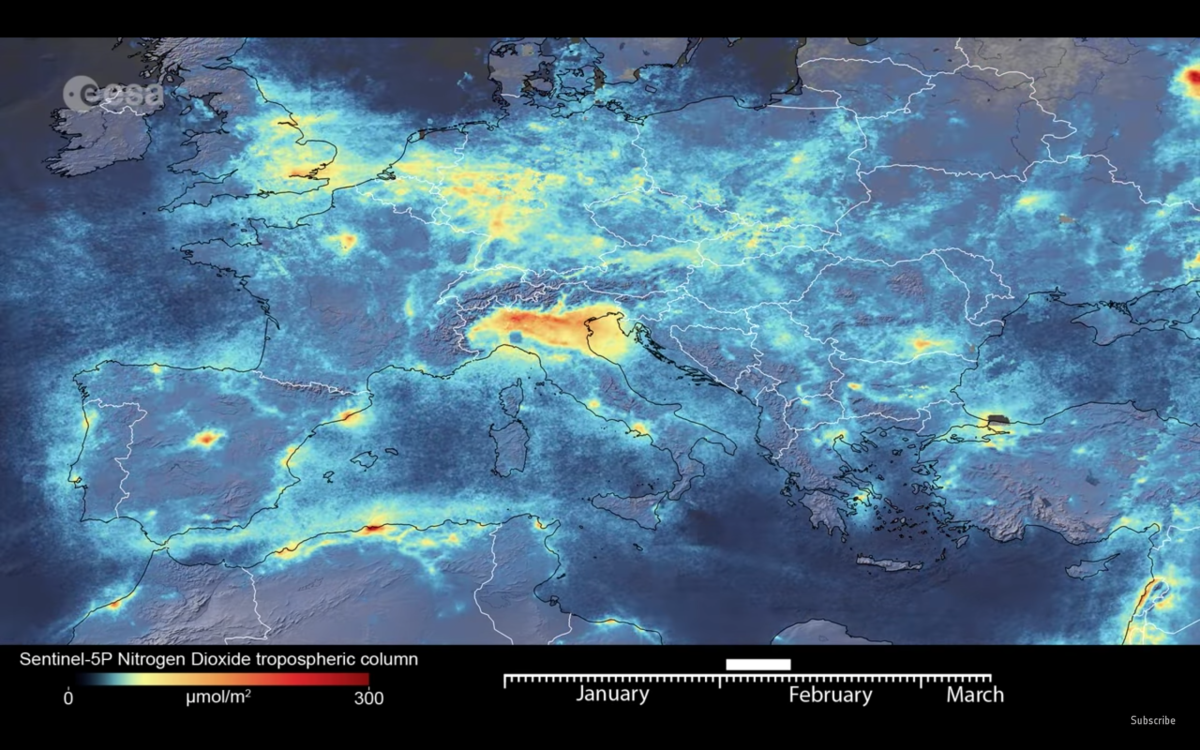
Monitoring by an ESA satellite has revealed a drop in nitrogen dioxide emissions over Italy following the coronavirus lockdown
ESA
As COVID-19 spreads around the globe and key elements of society grind to a halt, satellite data is revealing its impacts on air quality and emissions of harmful pollutants. As it did in China, a lockdown in response to the coronavirus in Italy has led to a drop in air pollution over the country, which scientists say is due to less traffic and industrial activity.
These findings are based on data gathered by the European Space Agency's (ESA) Sentinel-5P satellite, which maps trace gases in the atmosphere such as methane, carbon monoxide, sulphur dioxide and nitrogen dioxide.
Nitrogen dioxide is produced through the burning of fossil fuels and can therefore arise from cars, trucks, buses, power plants and other industrial facilities. A few weeks ago, NASA reported a huge drop in Chinese nitrogen dioxide emissions as parts of the country went into lockdown, and now it appears a similar process is at play in Italy, which has the largest number of COVID-19 cases outside of China.
The ESA has compiled data on nitrogen dioxide emissions across Europe between January 1 and March 11, using a 10-day moving average. This illustrates a drop in concentration of the airborne pollutant over Italy, with the northern region, where the lockdown was first implemented, exhibiting the most pronounced decline.
“The decline in nitrogen dioxide emissions over the Po Valley in northern Italy is particularly evident," says Claus Zehner, ESA’s Copernicus Sentinel-5P mission manager. “Although there could be slight variations in the data due to cloud cover and changing weather, we are very confident that the reduction in emissions that we can see, coincides with the lockdown in Italy causing less traffic and industrial activities.”
You can check out the animation below.
Source: ESA
No comments:
Post a Comment